
You can see that I am missing some data but the rest is reasonably accurate and been drawn from official results, speedo or GPS photos and my initial planning stuff. My record keeping hasn't been superb...


Apart from the distance ones, the graphs aren't that great at comparing the rides to each other. Over the years the way the ride has been scored and how it has been run (number of CP's etc) has changed quite a lot.
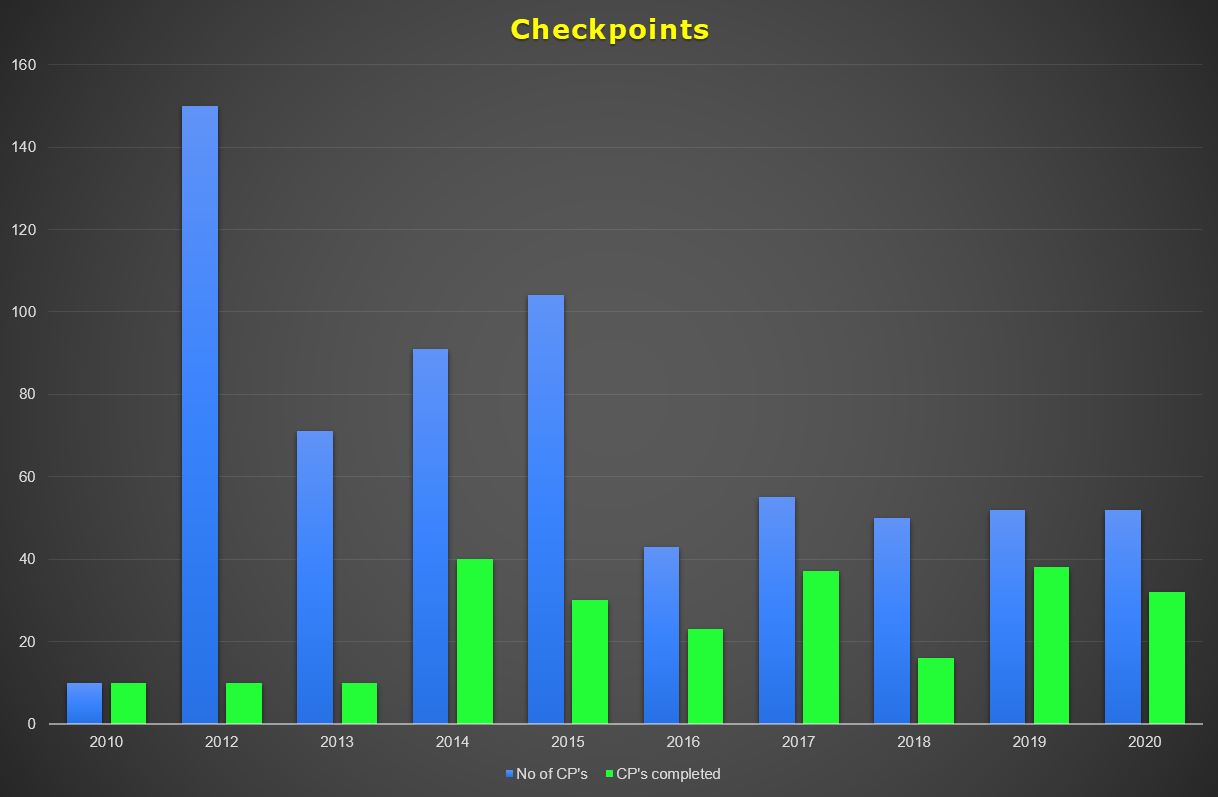
2019 and 2020 were run very similarly (except for the island they were in) and you can see this in the points and checkpoints graphs.
One huge anomaly is 2012 with a massive amount of checkpoints on offer. I didn't keep enough info but the points scoring was really interesting too. If you're interested the score sheet is here and it shows there was some radical stuff going on here. Mike had made the ride so that you could simply ride a standard 2,000km in 48 hours with just a few checkpoints or pick from a whole lot (including a side trip to Stewart Island and some "Compass Point" checkpoints) to allow you to claim bronze, silver, gold and diamond trophies.
For me the changing targets and the addition of adventure checkpoints have really kept the ride interesting and I really love the current format. As with a lot of the riders, the planning is a big part that adds to the enjoyment, challenge and feeling of accomplishment.
Hurry up with next year's challenge Wayne!
No comments:
Post a Comment